What is Stock Investing?

Most investors begin with a simple goal: investing in the stock market today with the intention of generating future returns.
While the goal may be similar, each investor’s approach can differ significantly, resulting in unique strategies tailored to their personal preferences, objectives, and risk tolerance.
If you are new to investing, you may have come across terms like Value Investing, Growth Investing, and Index Investing. But what exactly do these strategies involve, and how do they differ from one another?
Exploring these methods will help you identify the approach that best suits your financial goals and comfort with risk, setting the foundation for a more effective investment journey.


Basic Investment Terms for Stock Investing
Before you begin your first stock investment, it is important to understand a few essential concepts. These terms will help you make better decisions and set a strong foundation for your investing journey.
If you are new to investing, here are six important investment terms that can guide you, especially if you are exploring strategies like Value Investing, Growth Investing, and Dividend Income Investing.
By familiarising yourself with these terms, you will be better equipped to evaluate opportunities, manage risks, and build a portfolio that aligns with your long-term financial goals.

P/E ratio refers to how much you are paying to buy a stock for every $1 that it is able to earn.
The price-to-earnings ratio is also sometimes known as the price multiple or the earnings multiple.
P/E ratio of 10 would imply that an investor would need to pay $10 for every $1 that the company earns. High P/E ratio means that investors are anticipating higher growth in the future. Companies that are losing money do not have a P/E ratio.
In addition to showing whether a company’s stock price is overvalued or undervalued, the P/E can reveal how a stock’s valuation compares to its industry group.
The Price-to-Book (P/B) ratio, also known as the Price-to-Net Asset Value, is a metric used to compare a company’s market value with its tangible book value. The market value is determined by the company’s share price multiplied by the number of shares, while the book value is calculated by subtracting liabilities from total assets.
A P/B ratio of 1 indicates that the company’s market value is equal to its book value. When the P/B ratio is greater than 1, it suggests that the market values the company higher than its current book value, often reflecting expectations of growth or hidden value in its assets. Conversely, a P/B ratio below 1 means that the market values the company lower than its book value, which could indicate potential undervaluation or underlying business challenges.
The P/B ratio is particularly useful for assessing companies in asset-intensive industries such as banking, manufacturing, or real estate, where tangible assets represent a significant portion of value.
The Debt-to-Equity (D/E) ratio measures how much a company relies on debt compared to its equity. It highlights the extent to which a business is financing its operations and growth through borrowing.
A company may report strong earnings, but if those results are driven mainly by high leverage, the performance could be less sustainable. An increase in the D/E ratio is generally considered a negative sign because it indicates greater dependence on debt.
While leverage can amplify profits during good times, it also exposes businesses to significant risks during downturns. Excessive debt increases the likelihood of financial distress or even bankruptcy when market conditions become challenging.
The D/E ratio is a critical indicator of financial stability, making it an essential metric to evaluate before investing in any company.
If your investment goal is to enjoy passive income, it is essential to know which companies regularly pay dividends to their shareholders. A dividend is a portion of a company’s earnings or reserves that is distributed to shareholders in the form of cash payouts, often on a quarterly or annual basis.
However, dividend investing is not just about chasing the highest yield. A company that pays out very high dividends without the financial strength to sustain them may put investors at risk. Evaluating the stability of earnings, cash flow, and payout ratios is crucial to ensure the business can continue supporting dividend payments over the long term.
Sustainable dividend-paying companies can provide consistent income while also offering the potential for capital appreciation, making them a valuable component of a well-diversified portfolio.
Market capitalization, often called market cap, is the term used to describe a company’s total value as determined by the stock market. It is calculated by multiplying the current stock price by the total number of outstanding shares. In simple terms, it reflects how much a company is worth in the eyes of investors.
Many investors prefer companies with a larger market capitalization because they tend to offer greater liquidity, meaning their shares are easier to buy and sell. Large-cap companies are often seen as more stable, while mid-cap and small-cap companies may offer higher growth potential but with higher risk.
Market capitalization is a useful measure for comparing companies and plays an important role in shaping investment strategies based on risk tolerance and financial goals.
Beta is a measure of a stock’s volatility compared to the overall market. It indicates how sensitive a stock’s price is to market movements.
A beta below 1 suggests that the stock is less volatile than the market, making it relatively less risky. A beta above 1 indicates that the stock is more volatile, meaning it tends to move more sharply than the market average.
Whenever you buy a stock, it is helpful to check its beta, especially if you are new to investing. Knowing the beta gives you an idea of how volatile the stock is compared to the broader industry or market, helping you make better decisions that align with your risk tolerance.
Now that you are familiar with the six basic investment terms, it is time to explore the different strategies that investors use to build wealth.
Investment strategies vary widely, ranging from conservative approaches that focus on capital preservation to more aggressive methods that target higher growth. Each strategy is shaped by factors such as risk tolerance, time horizon, and financial objectives.
The most important question to ask is: Which strategy is best suited for you? By aligning your investment approach with your personal goals and comfort with risk, you can create a plan that is both effective and sustainable.
Different Types of Stock Investing Strategies
Let’s begin by explaining how each of these strategies works.

An index investing is not focused on picking individual businesses to outperform the market. Instead, the goal is to achieve the overall return of the market itself.
Rather than selecting specific stocks, index investing rely on tools like Exchange Traded Funds (ETFs) to mirror the performance of a market index. For example, the Straits Times Index (STI) ETF is designed to deliver returns that closely match the actual performance of the STI.
Index investing provides exposure to a diverse portfolio of high-quality companies listed on the stock exchange. This approach combines diversification, lower costs, and long-term growth potential, making it an attractive option for investors seeking steady returns without the need for active stock selection.
The guiding principle of Value Investing is simple: “Buy Low, Sell High.”
Value investing is a strategy where investors look for stocks they believe are undervalued by the market. The goal is to purchase these stocks at a lower price, with the expectation that their true value will be recognised over time, leading to profitable returns.
Although there is no guaranteed method to determine whether a stock is undervalued, most value investors rely on financial ratios such as the Price-to-Earnings (P/E) ratio and the Price-to-Book (P/B) ratio to estimate a company’s intrinsic value.
This approach requires careful stock analysis and valuation to uncover the intrinsic worth of a business. The principle is straightforward: buy when the stock price is below its intrinsic value, and sell when the price rises above its intrinsic value.
Value investing demands patience, discipline, and a long-term outlook, but it can reward investors with consistent returns when executed effectively.
Growth investing is built on the idea of buying into companies that have the potential to expand significantly in the future. Investors look for businesses that are expected to increase their income, market share, and profitability over the years ahead.
Growth stocks may not always display strong financial ratios or solid fundamentals today, and in some cases, these companies may not even be profitable yet. Despite this, investors choose them because they believe in the company’s long-term potential and bright future.
A firm is often classified as a growth stock due to its unique value propositions. For example, a company may already have millions of active users engaging with its products or services, even though it has not yet generated profits. While value investors may avoid such companies, growth investors see potential in this trajectory and may decide to purchase shares in anticipation of future success.
Growth investing requires vision and patience, as the rewards come from recognising opportunities early and holding through periods of volatility until the company matures.
Momentum investing is built on the idea of buying into trends. The concept is that stocks performing well are likely to continue rising, while underperforming stocks may keep declining. Investors aim to ride the momentum of strong stocks for profits and exit positions once the trend weakens.
Momentum investors rely primarily on technical analysis rather than company fundamentals. Unlike value investors, they are less concerned with earnings or operations, focusing instead on price action and the strength of market trends.
This strategy is considered a form of technical trading. To identify and measure momentum, investors often use tools such as moving averages, the Relative Strength Index (RSI), the Moving Average Convergence Divergence (MACD), Bollinger Bands, and volume analysis. These indicators help reveal patterns, highlight entry and exit points, and guide trading decisions.
Momentum investing requires discipline and risk management, as price trends can reverse quickly. For experienced investors, it can be a way to capture short- to medium-term gains by aligning with prevailing market movements.
Below are 4 of the most commonly used indicators for Momentum Investing / Trend Investing (Trend Lines, Moving Average, MACD and RSI)
1) Trend lines

Trend lines are one of the simplest yet most powerful tools in technical analysis for tracking price movements. A trend line is drawn by connecting two or more successive points on a price chart, helping investors visualise the general direction of a stock’s movement.
When the line is sloping upward, it signals a positive or bullish trend, suggesting that the stock price is rising. Investors may view this as an opportunity to buy shares and ride the upward momentum.
When the line is sloping downward, it indicates a negative or bearish trend, where the stock price is falling. In such cases, traders often interpret this as a signal to sell or take a defensive position.
Trend lines provide a visual guide to market sentiment and can be a valuable starting point for identifying entry and exit points in stock investing.
2) Moving Average (MA)

A moving average line helps traders identify the overall market trend by smoothing out short-term fluctuations in price. This makes it easier to focus on the bigger picture instead of being distracted by minor or insignificant changes.
When the price of a security remains consistently at or above the moving average, it generally signals an upward trend, often seen as a buying opportunity.
When the price stays at or below the moving average, it indicates a downward trend, which may suggest selling or adopting a defensive position.
If the price is consistently trading within a horizontal range around the moving average, it reflects a sideways trend, showing that the market has not established a clear direction.
Moving averages are widely used because they provide a straightforward visual indicator of momentum, helping traders make more confident entry and exit decisions.
3) Moving Average Convergence Divergence (MACD)

The Moving Average Convergence Divergence (MACD) indicator measures the relationship between two Exponential Moving Averages (EMAs). On a trading chart, the MACD is typically calculated using the 26-day and 12-day EMAs, although traders can adjust these settings to suit their strategy and backtesting results.
4. Relative Strength Index (RSI)
The Relative Strength Index (RSI) is a momentum indicator that compares the size of upward and downward movements in a stock’s closing price over a set period of time, typically 14 trading sessions.
The RSI is designed to signal whether a market is considered overbought or oversold relative to recent price levels. An overbought condition suggests that the price may be too high and could face a pullback, while an oversold condition indicates that the price may be undervalued and could be due for a rebound.
Traders use the RSI in different ways, such as confirming trend strength, spotting potential reversals, or identifying entry and exit points. By offering insight into market momentum, RSI is a valuable tool for both short-term traders and long-term investors.

In an uptrend, the Relative Strength Index (RSI) can be used to identify potential buy opportunities. A common signal occurs when the RSI dips below the 40 level and then rises back above it.
This movement suggests that, despite a temporary pullback, the broader trend remains strong. The dip below 40 indicates a period of short-term weakness, and the recovery above 40 signals renewed buying momentum. Traders often interpret this as a buy signal, aligning with the overall upward trend of the market.
By applying RSI in this way, investors can improve timing when entering long positions, increasing the chances of riding sustained price gains while minimising risk during corrections.

In a downtrend, the Relative Strength Index (RSI) can be used to spot potential selling opportunities. A typical signal occurs when the RSI climbs above the 60 level and then falls back below it.
This pattern suggests that, despite a brief rally, the dominant trend remains downward. The move above 60 reflects short-term strength, but the drop back below indicates renewed selling pressure. Traders often interpret this as a sell signal, aligning with the broader bearish trend.
Using RSI in this way allows investors to better time exits or short positions, helping them take advantage of ongoing downward momentum while avoiding false rallies.
Many of us dream of living without being tied to work commitments. Imagine setting your own schedule, taking vacations whenever you want, spending more time with your loved ones, and still having the income to support the lifestyle you desire.
One way to achieve this is by investing in assets that generate dividend income. By building a portfolio of dividend-paying investments, you can offset your lifestyle expenses and provide ongoing financial support for yourself and your family without depending solely on employment.
In Singapore, various stocks offer attractive dividend yields. For example:
Around 3% yield: ThaiBev, CapitaLand, ST Engineering, Jardine C&C
Around 5% yield: Singtel, UMS, Keppel REIT, QAF, Hong Leong Finance
Around 7% yield: Frasers Commercial Trust, ESR REIT, Mapletree Logistics, Taisin Electric
It is also important to note that dividend income is not limited to individual stocks. Other financial instruments such as Unit Trusts (UTs), Exchange Traded Funds (ETFs), and Bonds can also provide a reliable stream of passive income, helping you move closer to long-term financial independence.
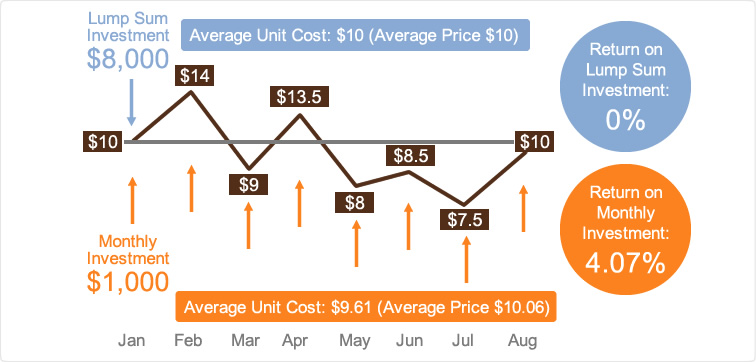
Dollar Cost Averaging (DCA) is one of the most reliable and time-tested investment techniques. Its popularity stems from its simplicity—you do not need a large lump sum to begin, and it removes much of the guesswork about when to invest.
With dollar cost averaging, you invest a fixed amount of money into a chosen stock, unit trust, or fund on a regular basis, usually every month, regardless of price fluctuations. This means you automatically purchase more units when prices are lower and fewer units when prices are higher.
This method helps remove impulsive decision-making and reduces the risk of mistiming the market. Since markets generally trend upward over the long term, dollar cost averaging allows you to stay invested and benefit from the compounding effect of steady contributions.
It can also be more rewarding to commit a portion of your salary each month to investments rather than keeping excess cash idle. By staying disciplined and consistent, dollar cost averaging gives you a structured path to building wealth and long-term financial security.
Many people think investing is only for the rich, but that is far from true. If you are wondering how to start investing with little or no experience, Dollar Cost Averaging (DCA) is one of the most affordable and effective approaches.
In Singapore, you can begin investing in blue-chip stocks such as DBS Bank, SPH, ComfortDelGro, Singtel, and CapitaMall Trust with as little as $100 per month.
This method has been available for years, especially through Unit Trust investments or what is known as a Regular Savings Plan (RSP). After making an initial lump sum contribution (commonly around $1,000), you can continue investing a fixed monthly amount into the same shares or unit trusts to benefit from the DCA effect.
Alternatively, you can start your own Regular Savings Plan with us from as low as $100 per month, making investing accessible to everyone regardless of starting capital.
How to Screen and Filter Companies for Stock Investing
If you are new to investing, the Singapore Exchange (SGX) offers a user-friendly stock screening platform that makes it easy to shortlist stocks based on your specific needs.
With this tool, you can quickly compare different stocks and review key details such as the Price-to-Earnings (P/E) ratio, Dividend Yield, and company information. It is an excellent starting point for identifying potential opportunities that align with your financial goals.
Best of all, the SGX Stock Screener is free to use and does not require any sign-up. Simply visit the platform, explore the available filters, and begin building your shortlist of stocks worth considering.

Which Investment Strategy is Best for You?
While the main purpose of investing is to generate profits from the stock market, it is equally important to select strategies that truly make sense for your individual circumstances. A strategy that works well for one investor may not necessarily work for another.
Before deciding on the investment approach that suits you best, take time to consider these key variables:
Financial Goals: Are you aiming for steady income, long-term growth, or early retirement?
Risk Tolerance: How comfortable are you with market fluctuations and potential short-term losses?
Time Horizon: Are you investing for a short-term goal, or do you have decades to allow your wealth to grow?
Capital Available: Do you have a significant lump sum to invest, or will you build your portfolio gradually?
Knowledge and Involvement: Do you prefer active strategies that require monitoring, or passive approaches that demand less attention?
By evaluating these factors, you can align your strategy with your unique needs, creating an investment plan that balances confidence, growth potential, and long-term security.
Key Factors to Consider Before Choosing Your Investment Strategy
Know How to Identify and Analyse
To be successful in both value and growth investing, you must understand how to identify and analyse stocks effectively. Without this knowledge, you may overlook the right opportunities or make poor investment choices.
Diversification
Managing risk is crucial. A well-diversified portfolio spreads your investments across different asset classes and sectors, balancing risk and return while protecting you from overexposure to any single market or company.
Understand Your Risk Tolerance
Every investor has a different comfort level with risk. Growth investing is generally more volatile and often most affected during recessions. Value investing, while not risk-free, tends to be less risky as it focuses on high-quality stocks purchased at attractive prices. Knowing your risk tolerance helps you align your strategy with your financial goals.
Personal Interest
Your own interests can shape your investment approach. For example, if you follow technology news and enjoy exploring innovative products, you may naturally gravitate toward investing in technology companies like Apple, Alphabet, or Amazon. Aligning your investments with your passions can keep you motivated and engaged.

Give Your Assets the Opportunity to Grow
With our expertise, we will help you design and implement a personalised investment strategy tailored to your unique goals.
At One Stop Financial, we are your trusted experts in asset management and investment advisory. Together with our network of highly qualified partners, we provide a comprehensive suite of wealth planning services that position your assets for sustainable growth and long-term success.
Our approach combines professional insight, customised solutions, and a commitment to building financial security, ensuring your wealth works harder for you.